Copernicus: Antarctic sea ice extent reaches all-time minimum in February – Second warmest winter on record in Europe

 |
The Copernicus Climate Change Service (C3S), implemented by the European Centre for Medium-Range Weather Forecasts on behalf of the European Commission with funding from the EU, routinely publishes monthly climate bulletins reporting on the changes observed in global surface air temperature, sea ice cover and hydrological variables. All the reported findings are based on computer-generated analyses using billions of measurements from satellites, ships, aircraft and weather stations around the world.
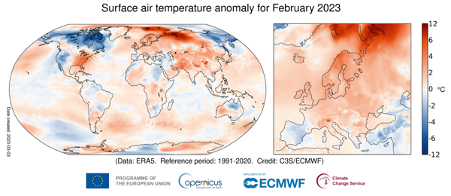
February 2023 — temperature highlights:
· February 2023 was the fifth warmest globally
· Most of Europe had above-average air temperatures, particularly northern Norway and Sweden, and the Svalbard region
· Above-average temperatures occurred in the eastern United States, northern Russia, and in Pakistan and India
Advertisement· Below-average temperatures were experienced across the Iberian Peninsula, Türkiye, the western United States, Canada, northeast Russia, and northern Australia
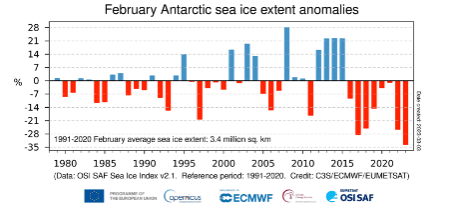
February 2023 – Sea ice highlights:
· Antarctic sea ice reached its lowest monthly extent in the satellite data record, at 34% below the average for February, breaking the previous record of February 2017.
· Antarctic daily sea ice extent also reached an all-time minimum, surpassing the previous record set in February 2022.
· Sea ice concentrations were much below-average in all sectors of the Southern Ocean.
· Arctic sea ice extent was 4% below average, ranking 2nd lowest for February in the satellite data record, jointly with February 2016 and 2017.
· Arctic sea ice concentrations were most below-average in the Barents Sea and Svalbard region.
 |
According to Samantha Burgess, Deputy Director of C3S, "Our latest data show that Antarctic sea ice reached its lowest extent in the 45-year satellite data record. These low sea ice conditions may have important implications for the stability of Antarctic ice shelves and ultimately for global sea level rise. Polar ice caps are a sensitive indicator of the climate crisis and it is important to closely monitor the changes occurring there.”
 |
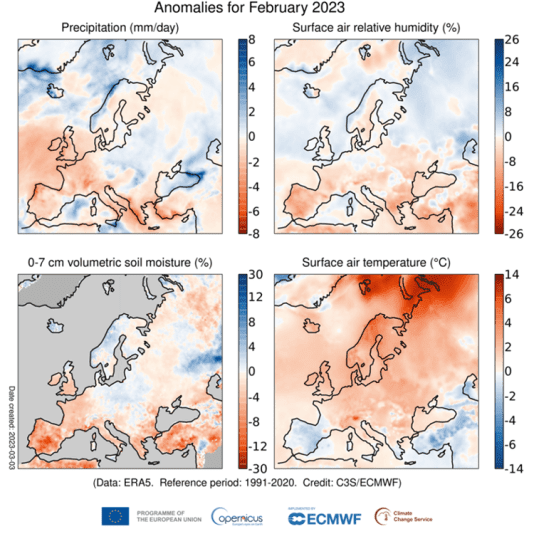
Hydro highlights for February 2023:
· In February 2023, most of western and southern Europe experienced drier-than-average conditions, several regions saw record low levels of soil moisture.
· Beyond Europe, it was wetter than average in southern USA, regions of Russia, central and eastern Asia, northern Australia, southern Brazil, south-eastern Africa and New Zealand. In many cases, heavy precipitation, sometimes associated with cyclones, led to flooding.
· Among the drier-than-average regions were parts of South America, which experienced drought and wildfires, as well as southern Australia and west of southern Africa.
 |
Boreal winter 2022/2023
· Winter was the joint second warmest on record for Europe, with much above-average temperatures over eastern Europe and parts of north-eastern Europe
· Boreal winter was drier than average for much of western and south-eastern Europe, as well as regions of Russia. Wetter-than-average conditions established over parts of Iberia and in a large southwest to northeast region across the continent.
· It was wetter than average also in the west of North America, western Russia, part of central Asia, north Australia, southern Brazil and southern Africa. Drier-than-average regions included Mexico, most of Central Asia, the Horn of Africa, south Australia and much of South America.
Video material accompanying the maps can be found here.
More information about climate variables in February and climate updates of previous months as well as high-resolution graphics and the video can be downloaded here.
Answers to frequently asked questions regarding temperature monitoring can be found here.
Information about the C3S data set and how it is compiled.
Temperature and hydrological maps and data are from ECMWF Copernicus Climate Change Service’s ERA5 dataset.
Sea ice maps and data are from a combination of information from ERA5, as well as from the EUMETSAT OSI SAF Sea Ice Index v2.1, Sea Ice Concentration CDR/ICDR v2 and fast-track data provided upon request by OSI SAF.
Regional area averages quoted here are the following longitude/latitude bounds:
Globe, 180W-180E, 90S-90N, over land and ocean surfaces.
Europe, 25W-40E, 34N-72N, over land surfaces only.
More information can be found here.
Information on national records and impacts
Information on national records and impacts are based on national and regional reports. For details see the respective temperature and hydrological C3S climate bulletin for the month.
C3S has followed the recommendation of the World Meteorological Organization (WMO) to use the most recent 30-year period for calculating climatological averages and changed to the reference period of 1991-2020 for its C3S Climate Bulletins covering January 2021 onward. Figures and graphics for both the new and previous period (1981-2010) are provided for transparency.
More information on the reference period used, can be found here.
| C3S_MonthlyMaps_February 2023- ENG_Final.docx 3.45 MB |
| Surface air temperature anomaly for February 2023.png 131.35 KB |
| February Antarctic sea ice extent anomalies.png 39.59 KB |
| Daily Antarctic sea ice extent.png 184.01 KB |
| Anomalies for February 2023.png 690.52 KB |
Share this article:
Related items
Monday, 05 February 2024 06:06
Scientists and engineers have t