Road safety in the EU: Fatalities below pre-pandemic levels but progress remains too slow

Contrasting trends across member states
EU-wide, road deaths in 2022 rose by 3% on the previous year, not least as traffic levels recovered levels following the pandemic. Importantly, many of the gains achieved during the COVID-19 period (including a fall of 17% between 2019 and 2020) have not been lost. Compared with 2019, the number of deaths in 2022 fell by 10%.
However, progress has been very uneven between Member States. The largest decreases, of more than 30%, were reported in Lithuania and Poland, with Denmark also recording a 23% fall. By contrast, over the last three years, the number of road deaths in countries such as Ireland, Spain, France, Italy, the Netherlands, and Sweden has remained rather stable or has risen¹ .
The overall rankingof countries’ fatality rates has not changed significantly since prior to the pandemic with the safest roads in Sweden (21 deaths per one million inhabitants) and Denmark (26/million) while Romania (86/million) and Bulgaria (78/million) reported the highest rates in 2022. The EU average was 46 road deaths per million inhabitants.
Most affected groups
AdvertisementWithin urban areas, the pattern is however very different with vulnerable road users (pedestrians, cyclists and users of powered two-wheelers) representing just under 70% of total fatalities. Urban road user fatalities occur overwhelmingly in crashes involving cars and trucks and thus highlight the need to improve the protection of vulnerable road users.
While the increased share of cycling in the mobility mix in many Member States is extremely welcome, a serious cause for concern is the trend in the number of cyclists killed on EU roads. This is the only road user group not to see a significant drop in fatalities over the last decade, which is notably due to a persistent lack of well-equipped infrastructure. In 2022, for example, preliminary figures from France show a 30% increase in cycling fatalities compared with 2019.
Background
In 2018, the EU has set itself a 50% reduction target for road deaths – and, for the first time, also serious injuries – by 2030. This was set out in the Commission’s Strategic Action Plan on Road Safety and EU road safety policy framework 2021-2030 which also lay out road safety plans aiming to reach zero road deaths by 2050 (‘Vision Zero’).
Road safety has also been a core element of recent EU mobility policy initiatives including the Sustainable and Smart Mobility Strategy, the Commission proposal for a revision of the TEN-T regulation and the Urban Mobility Framework.
The EU is at the forefront of the Second Decade of Action for Road Safety, proclaimed by the UN for 2021–2030 in August 2020.
In the coming weeks, the Commission will present a package of proposals tackling road safety from a range of angles to make European roads safer still.
For more information
Road safety statistics 2022 in more detail
Road deaths per million inhabitants – preliminary data for 2022
| Rate per million population | % change 2022 in relation to: | ||||||
| 2019 | 2020 | 2021 | 2022 | 2021 | 2019 | Average 2017-19 | |
| EU-27 | 51 | 42 | 45 | 46 | 3% | -10% | -11% |
| Belgium | 56 | 43 | 45 | 52 | 16% | -7% | -3% |
| Bulgaria | 90 | 67 | 81 | 78 | -5% | -15% | -17% |
| Czechia | 58 | 48 | 50 | 50 | -1% | -15% | -15% |
| Denmark | 34 | 28 | 22 | 26 | 18% | -23% | -15% |
| Germany | 37 | 33 | 31 | 34 | 9% | -8% | -12% |
| Estonia | 39 | 44 | 41 | 38 | -9% | -4% | -10% |
| Ireland | 29 | 30 | 27 | 31 | 14% | 11% | 9% |
| Greece | 64 | 54 | 57 | 58 | 1% | -11% | -13% |
| Spain | 37 | 29 | 32 | 36 | 12% | -2% | -5% |
| France | 50 | 39 | 45 | 49 | 11% | 0% | -2% |
| Croatia | 73 | 58 | 72 | 71 | -6% | -7% | -13% |
| Italy | 53 | 40 | 49 | 53 | 9% | -2% | -5% |
| Cyprus | 59 | 54 | 50 | 42 | -16% | -27% | -26% |
| Latvia | 69 | 73 | 78 | 60 | -24% | -15% | -19% |
| Lithuania | 67 | 63 | 53 | 43 | -19% | -35% | -35% |
| Luxembourg | 36 | 42 | 38 | 40 | 8% | 18% | -6% |
| Hungary | 62 | 47 | 56 | 56 | -1% | -10% | -13% |
| Malta | 32 | 21 | 17 | 50 | 189% | 63% | 47% |
| Netherlands | 34 | 30 | 29 | 35 | 20% | 4% | 7% |
| Austria | 47 | 39 | 41 | 41 | 2% | -11% | -11% |
| Poland | 77 | 66 | 59 | 51 | -14% | -34% | -33% |
| Portugal | 67 | 52 | 54 | 63 | 16% | -5% | -2% |
| Romania | 96 | 85 | 92 | 86 | -8% | -12% | -14% |
| Slovenia | 49 | 38 | 54 | 40 | -25% | -17% | -14% |
| Slovakia | 50 | 45 | 45 | 46 | 0% | -8% | -8% |
| Finland | 38 | 40 | 41 | 34 | -16% | -10% | -18% |
| Sweden | 22 | 20 | 20 | 21 | 5% | 0% | -17% |
| Switzerland | 22 | 26 | 23 | 31 | 35% | 44% | 25% |
| Norway | 20 | 17 | 15 | 23 | 55% | 15% | 16% |
| Iceland | 17 | 22 | 24 | 24 | 0% | 50% | -33% |
The 2022 figures are based on preliminary data for most countries and are subject to changes when the final data are released in autumn 2023. Estimates for 2022 cover the whole year and all roads and refer to deaths within 30 days but for the following countries they are based on partial data: Germany and Greece (each 11 months), Belgium and Hungary (each 9 months), Spain (rural roads), Netherlands (partial data; also, police-registered fatalities are under-reported by around 10-15%), Portugal (fatalities within 24 hours), Switzerland (6 months). No data for Liechtenstein for 2022.
Data for 2022 are compared with three time-periods: 2021 (the previous year), 2019 (the baseline year for the target of 50% fewer deaths by 2030) and the average of 2017-19 (to take account of fluctuations in small countries). The percentage changes in the table are based on the absolute number of fatalities, not the rate per million population.
2022 Road safety statistics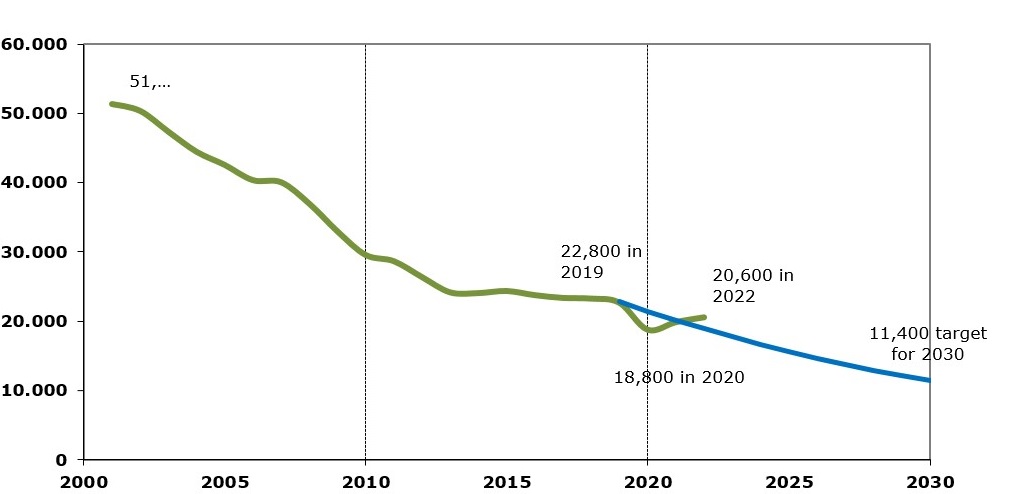
Share this article: